Security Detection Playground - Part 2
Introduction
Welcome to part 2 of my walkthrough for building a hands-on threat detection lab. In part 1, we set up Proxmox, along with OPNsense to act as a firewall/router in front of our lab network. We also set up a WireGuard tunnel to allow us to access machines within the lab network. In this post, we will set up Elasticsearch as our SIEM, and learn how to gather and forward logs, starting with logs from OPNsense.
Setting up Elasticsearch
Creating the Ubuntu VM
We’re going to start by creating an Ubuntu VM to run the Elastic Stack on. I used this script from the ProxmoxVE Helper Scripts site, as this speeds up the process considerably. Run the script in the Proxmox node’s console, and go through the advanced setup to choose CPU, RAM, and storage.
I personally gave the VM 350 GB of storage, 8 CPU cores, and 8192 MB of RAM (8 GB), but you can probably get away with half of that. Make sure to set the bridge to vmbr1 when prompted. If you’re not sure what an option is, leave the default. Do not start the VM when completed. We still need to set up other settings in cloud-init.
When the script is finished running, go to the “Cloud-Init” tab in the VM’s settings, set the correct values, and click “Regenerate Image.” I used the following:
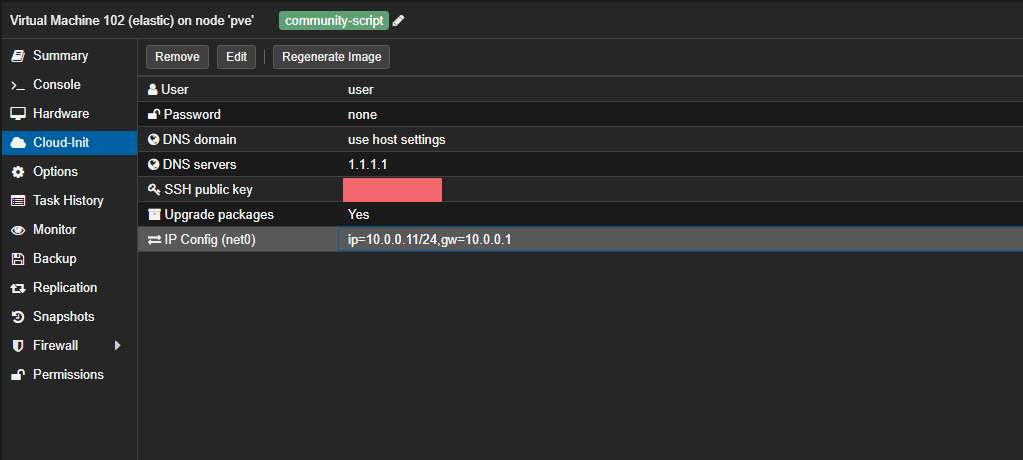
You can then start the VM. After cloud-init finishes setting up the box, you can log in via SSH. Make sure you’re on the WireGuard VPN. At this point, its good to make sure you have a swap file, as I found this increased system stability for me. Set it up with:
|
|
Next, set up Docker with the following:
|
|
Because the Elastic stack Docker setup can generate a lot of logs and fill up disk, we should limit the amount of logs each container can generate. Create /etc/docker/daemon.json with the following content:
|
|
Then restart Docker with:
|
|
Log out and back in for the Docker group membership to take effect, and then install build essentials:
|
|
Setting up Elasticsearch
We’re going to run the Elastic Stack in Docker from the following repo: elastdocker. Clone the repo and cd into it with:
|
|
Open the .env file in your favorite text editor and change the following values:
ELK_VERSIONto8.18.0ELASTICSEARCH_HEAPshould be set to half the amount of RAM on the VMLOGSTASH_HEAPshould be set to 1/4th ofELASTICSEARCH_HEAP
Next, bring the Elastic Stack up with:
|
|
You can then go to https://10.0.0.11:5601/ in your browser, and log in with elastic:changeme.
We’re going to start by setting up Fleet and Elastic Agents. This will enable us to start collecting logs from OPNsense, as well as from the VMs themselves. What we will set up initially is the Elastic Agent that will act as the Fleet Server itself.
The architecture of Fleet and Elastic Agents works as follows:
- One or more Elastic Agents are designated as Fleet Servers. These are the servers that all the rest of the agents talk to in order to get configs. In our case, we will use one Fleet Server and set it up on the same VM that the Elastic Stack is running on. This isn’t necessary though, so feel free to set up another small VM just for the Fleet Server. Just note that your IPs will be slightly different in some of the following steps.
- The Elastic Agents gather logs from their host, listen for logs on specified ports, or gather logs from API endpoints depending on the log source. These are set up via integrations. One of the big advantages of using Elastic as a SIEM is its rich library of integrations that make ingesting logs from many sources really easy. The Elastic Agents forward these logs directly to the Elastic cluster. They do not ship the logs through the Fleet Server.
Note: In a production deployment, firewall rules may prevent agents from talking to the Elastic cluster directly, so this architecture is important to understand.
Start by going to Fleet in the left-hand menu and adding a Fleet Server. Set the name to something like fleet-srv and the URL to https://10.0.0.11:8220. Click Generate, then copy the command to the Elastic VM. Change --fleet-server-es to https://10.0.0.11:9200 (note the https) and add --insecure --fleet-server-es-insecure to the end. The command will look something like this:
|
|
Run it, and let the Elastic Agent set up.
In the Fleet section in Elastic, go to the Settings tab and edit the default output. Change the Hosts option to https://10.0.0.11:9200, and add the following to the Advanced YAML configuration section:
|
|
Save and apply settings. Because our setup is using https everywhere, we have to tell the agents to use ssl everywhere—but not to be strict about verifying SSL certificates, since ours are self-signed.
At this point, I strongly encourage you to do a lot of poking around in Elasticsearch before moving on with the walkthrough. Elasticsearch is an extremely powerful tool that can be very complex at times, especially to beginners. Take some time to watch a few videos or read some tutorials on how Elastic works. AI will also be a great resource here, as it should be able to explain nearly everything to you. The Elastic docs are also a great resource that should be explored.
To start, take a look at the following doc generated by ChatGPT specifically for this post.
Ingesting OPNsense Logs
Setup in Elasticsearch
The first logs that we will collect will be NetFlow logs from OPNsense. NetFlow is a network protocol developed by Cisco that collects and analyzes IP network traffic data to monitor and troubleshoot network performance and security. We will use it to get an idea of what the VMs in our lab network are talking to outside the lab network.
To do this, we will add the NetFlow integration to our Elastic Agent policy:
- Go to Fleet in the left-hand menu, then click on Agent policies.
- Find and click on the policy that is assigned to the Fleet Server (likely named
fleet-server-policy). - Click Add integration.
- Search for “NetFlow” and select the NetFlow Records integration.
- Click Add NetFlow Records.
- Under Configure inputs, set the Listening Port to the port on which NetFlow logs will be received. The default is usually
2055, which you can use unless you’re using a custom port. - Use
0.0.0.0as the host to listen on. - Make sure to add the integration to the existing Fleet Server Policy.
- Click Save and continue, then Add to policy.
Once added, the Fleet Server will begin listening for NetFlow data. In the next section, we’ll configure OPNsense to send NetFlow logs to the Fleet Server so they can be ingested and analyzed by Elasticsearch.
Configuring OPNsense NetFlow
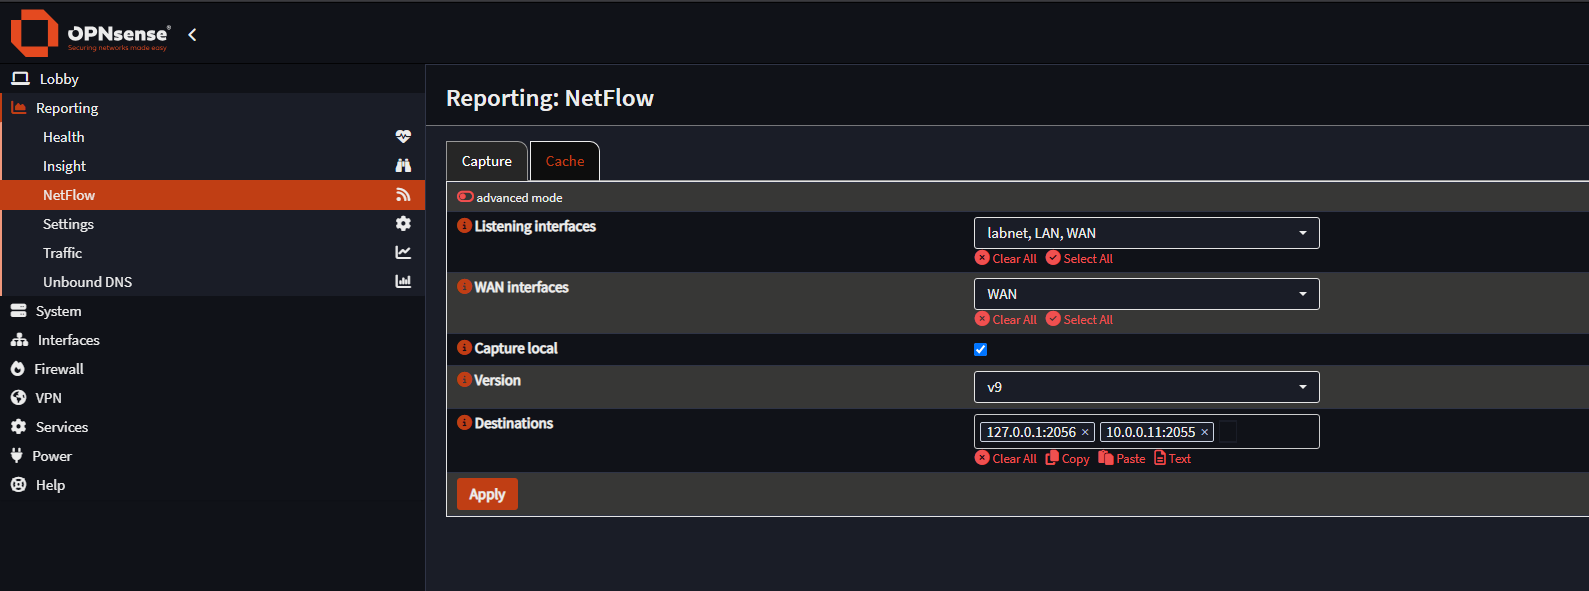
To forward NetFlow data from OPNsense to Elasticsearch, use the following configuration in the OPNsense UI:
- Navigate to Reporting > NetFlow in the left-hand menu.
- Enable Advanced Mode.
- Under Listening interfaces, select all internal and external interfaces that should be monitored (e.g.,
labnet, LAN, WAN). - Under WAN interfaces, select
WAN. - Enable Capture local.
- Set the Version to
v9. - In the Destinations field, add the IP address and port of your Fleet Server. You can add multiple destinations if needed. In our case:
127.0.0.1:2056(for local capture/inspection)10.0.0.11:2055(to forward to Fleet Server)
- Click Apply.
You should now see NetFlow data being ingested into the Elastic Stack. Check the Data Streams or Discover tab in Kibana to verify that logs are arriving. Check out the built-in dashboards to see some cool visualizations of the data.
A Note on Log Retention
Log management and retention is a crucial part of managing a SIEM. You will have to manage how long you keep specific types of logs, and if you want to filter out specific messages within log types. This allows you to keep useful logs for longer, while making searching through the logs easier. We won’t be doing much of that in this series, but as this is a test cluster and we have limited storage space, we will need to delete logs older than a few days. The process is a bit involved, but this guide from Elastic should help you out.
Ingesting Threat Intelligence
Elastic has a few integrations that allow you to ingest threat intelligence from various sources and use that intel to create alerts. We can very easily start ingesting some by adding the AbuseCH integration. Add it the same way we did with the NetFlow integration. You can sign up to get an API key if you want to make sure you don’t get rate limited.
Creating Our First Custom Alert
With our ingested threat intelligence data, we can create our first alerting rule. The goal of this rule is to alert when we observe traffic going from an internal IP in the lab network to a known malicious IP that we have in our threat intelligence data. Go to Security > Rules > Detection rules (SIEM) from the left-hand menu, and create a new rule. We are going to create a rule with type “Indicator Match” with the following settings:
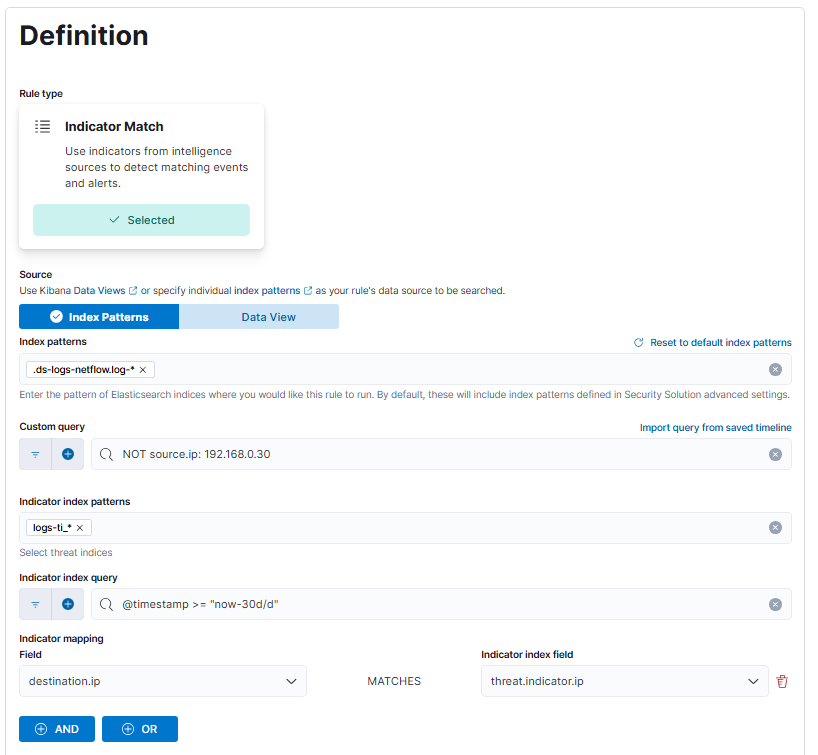
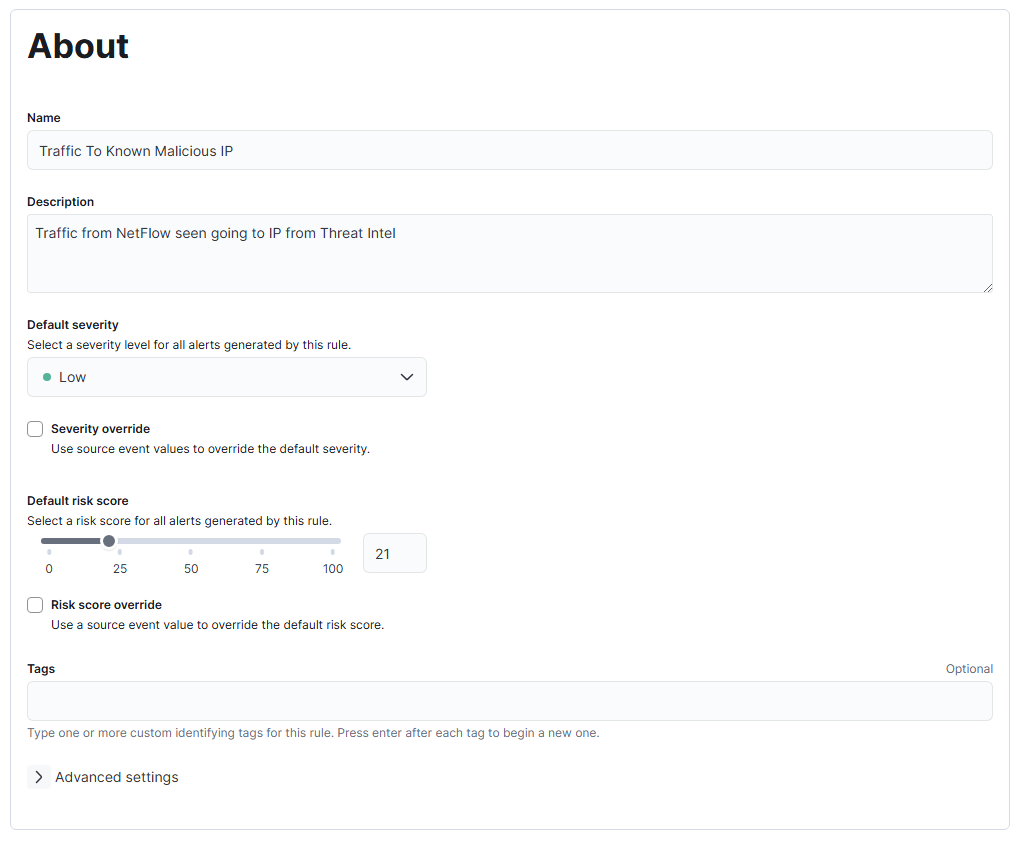
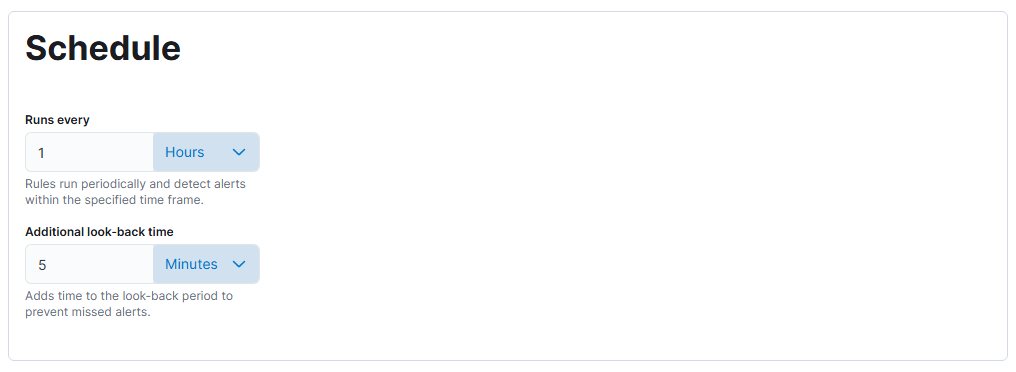

What we have set up is a rule that will run every hour and check all the IP addresses in the destination.ip field in the NetFlow logs against all the IPs in the threat intel logs. If it finds any matches, an alert will be created. Unfortunately, as we don’t have a subscription, we can’t send the log data anywhere, so we have to be content with using the log connector action. Rest assured that we will still see the alert in the “Alerts” tab. Also note the Rule preview button that will allow you to test the rule as you write it. You can generate a log to test with by finding an IP in the threat intel logs and pinging that IP with ping <MaliciousIP> -c 1, which will ping that IP once, which is sufficient to generate a flow. Wait a moment for that log to show up in Elastic, and then preview the rule to make sure it works. Save the rule, and then run it manually to see results.
Wrapping up Part 2
That’s it for this post. I encourage you to get more familiar with Elasticsearch by checking out some of the other integrations and having a go at creating some more alerts. In the next post, we’ll explore ingesting custom logs and how to parse them, as well as how to write some more alerts based on those logs.